Methodology: Using Storm Clustering to Identify Large Scale Events
Identification of storm events in historical metocean data is a critical part of the derivation of return period extremes and in the understanding of harsh conditions experienced offshore. Peak conditions by variable (wind speed, wave height, current speed, etc.) stratified by forcing conditions (tropical, extra-tropical, monsoonal, etc.) and by direction are all typical requirements for operations and design of offshore structures. In order to develop design-level metocean hindcasts, Oceanweather faces the challenging task of reviewing and reanalyzing events over a large spatial and temporal domain to ensure peak conditions are well resolved and unbiased. To meet this challenge, a new storm clustering technique has been developed and applied in the latest Joint Industry Project: Brazil Offshore Meteorological and Oceanographic Study (BOMOS-2).
Traditionally, only a handful of locations (using model data or measurement sites) were surveyed for storm peaks. When a peak from one site occurred within a short time window of a peak from another site, they could be combined into events. A meteorologist had to decide if secondary (farther away in time) peaks simply extended the event or should be treated as a new, separate event. After filtering duplicate peaks/events by hand, these event lists became the potential storm candidate lists. Location selection was critical – too far apart and storms could slip between sites and too close together created a lot of noise for the meteorologist to filter when combining the peaks.
Oceanweather’s new software tool evaluates long-term model or measured data by identifying peak event time periods (includes the peak and rise and fall on either side of the peak) of scalar variables such as wind speed, wave height, current speed, or surge height over an entire regional grid and then clusters the individual peaks together by time and space to result in a ranked order storm list. A time window allows a storm to propagate across the grid and a space window connects the same event at a location to its neighbors. Further restrictions on overall rank and/or sector rank can identify an important event in a particular location that would not have been found in a traditional storm candidate list. For example, a location that sees winds and waves out of a very narrow band of directions nearly constantly (e.g. Caribbean Sea has strong easterlies nearly continuously) might identify a northern event that is half of normal (e.g. in the Caribbean this could be associated with a strong winter cold front) but could have devastating effects to a structure if exposed to the north.
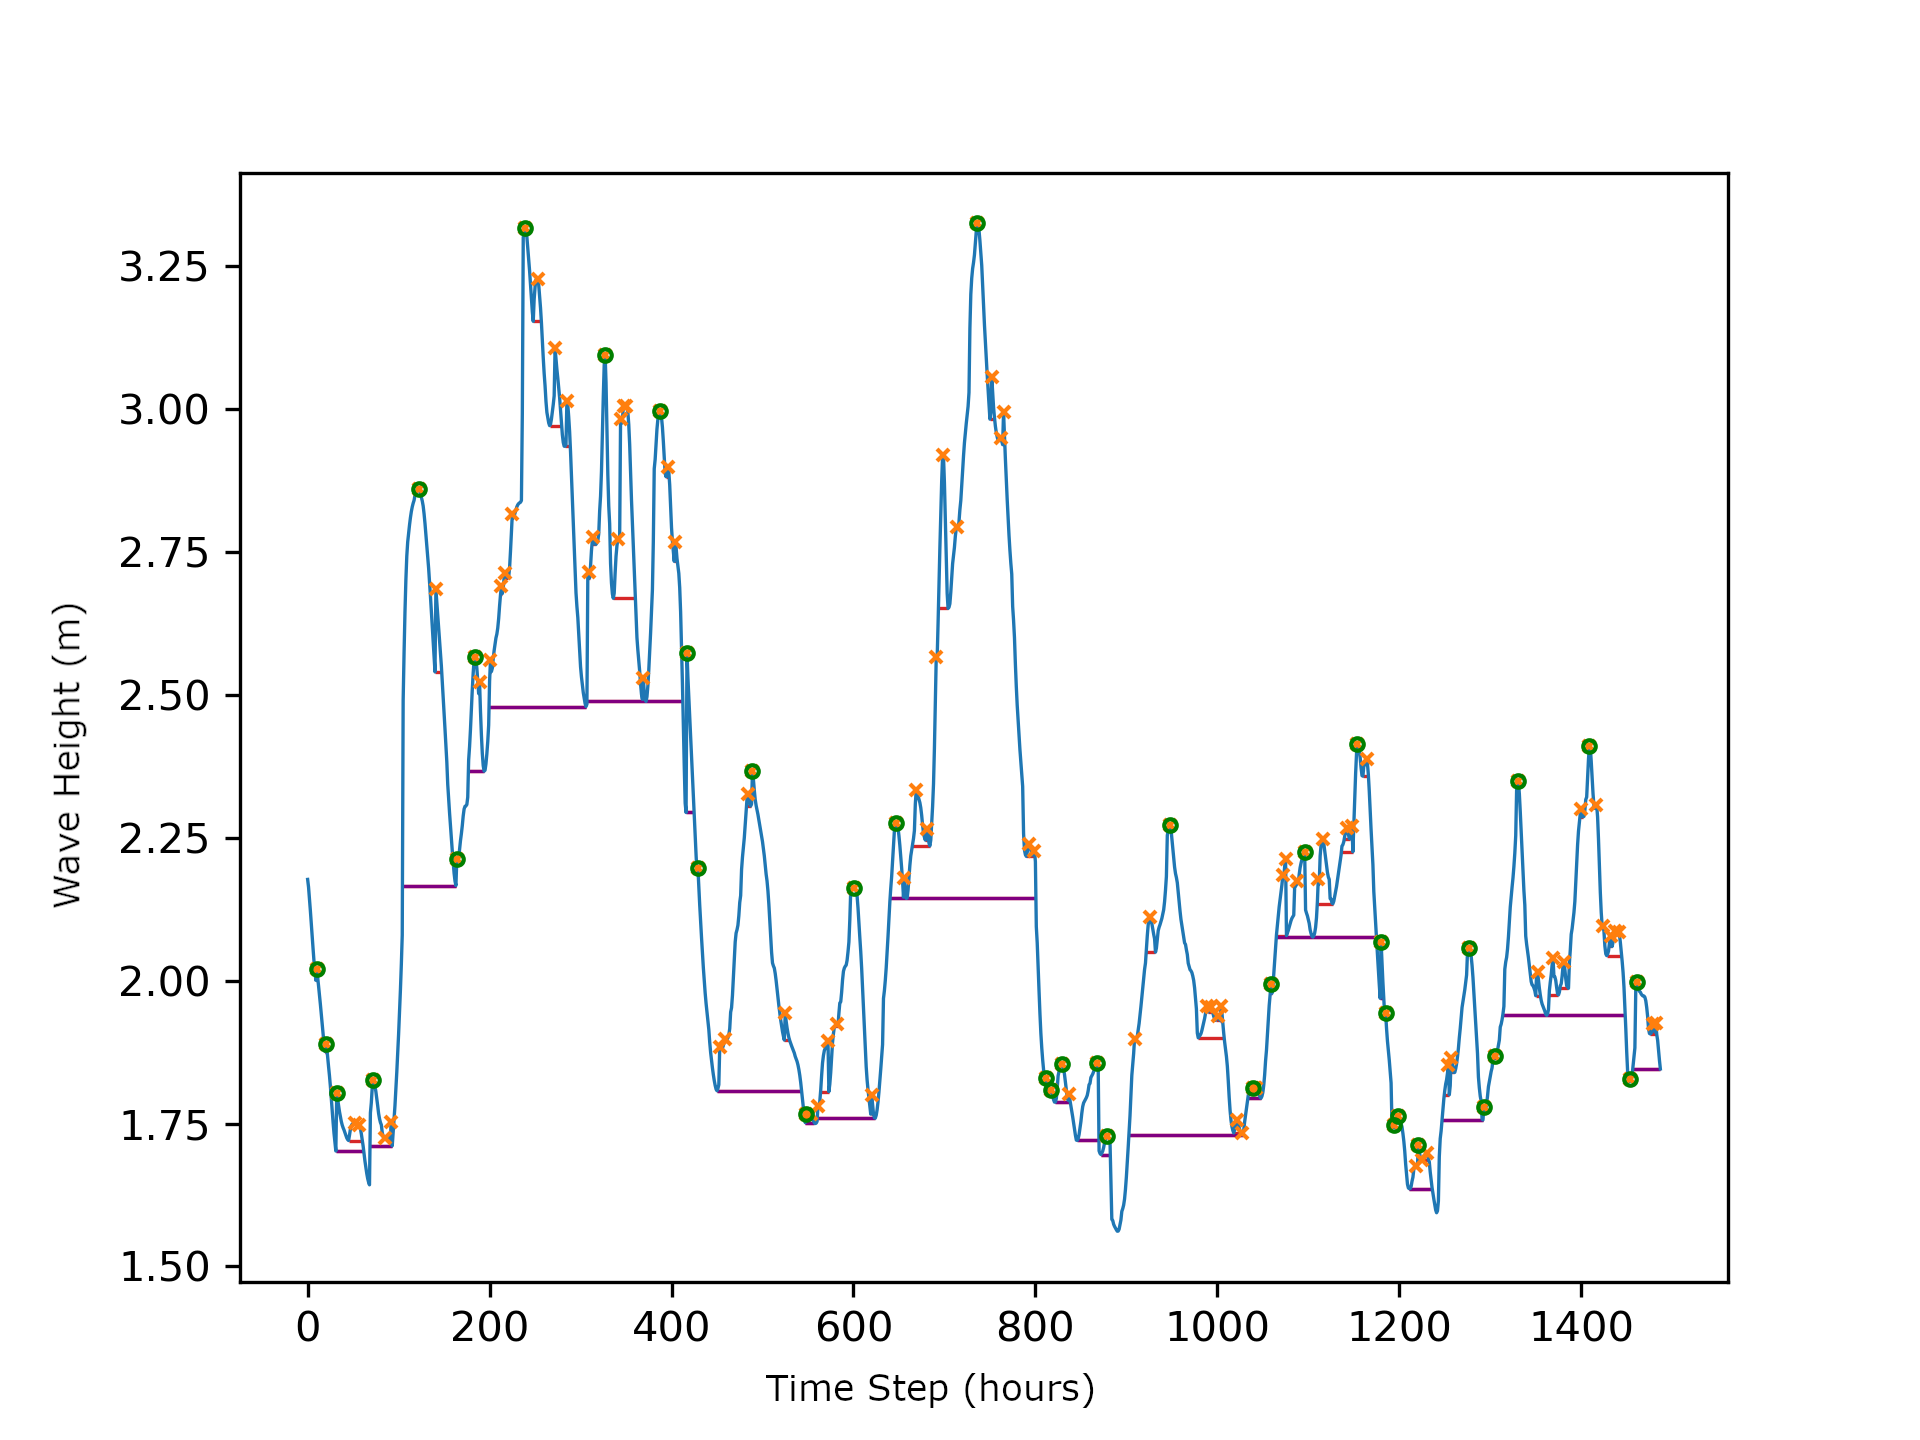
The figure below shows a sample set of identified wave peaks at a single location for a 2-month period. Local peaks are identified by an orange “X” and the green circles represent an event peak that may encompass numerous local peaks. The local storm peak length (in time) is indicated by a red line while the purple line represents the length of an entire event.
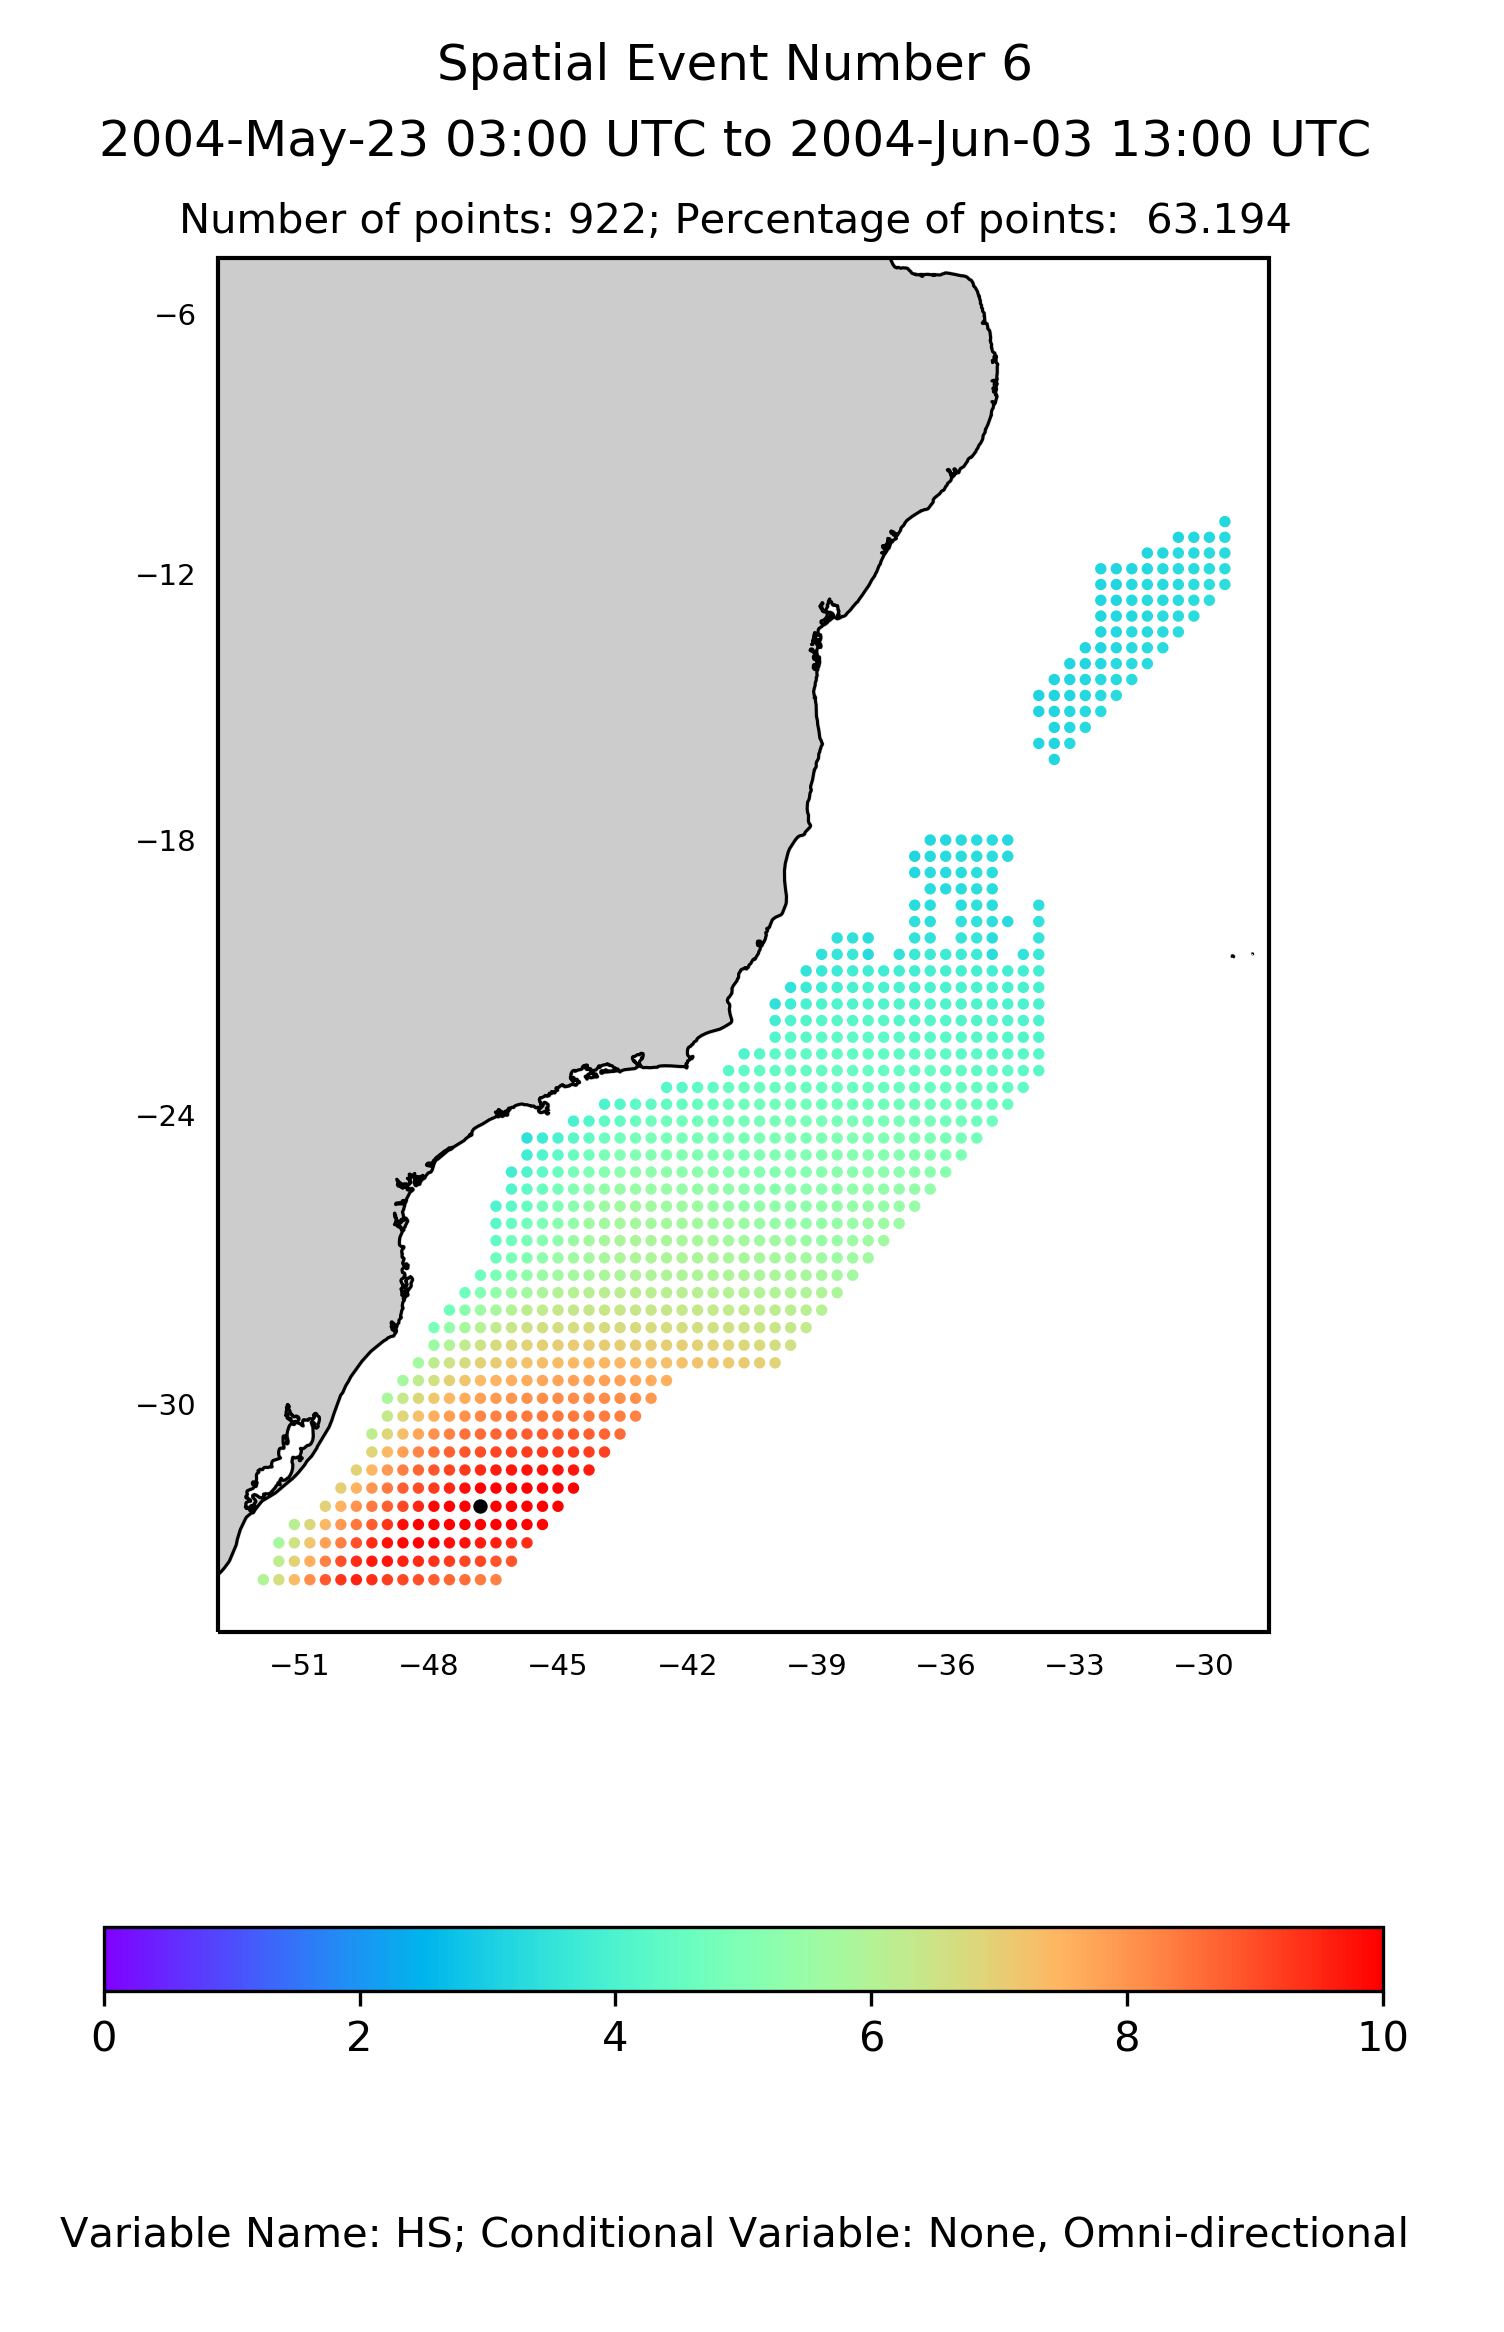
After identifying the local peaks above a minimum threshold and combining them into events at individual points, the algorithm performs the spatial clustering. Figure 2 shows the spatial coverage of a single event offshore Brazil from the BOMOS-2 JIP. The heat map indicates the wave height peak value. The black dot shows the highest peak for that event.
In addition to using storm clustering as a method to create storm candidate lists for an entire JIP, Oceanweather can also use this tool for site-specific reports to identify final rankings and tallies of hindcasted storm events. For site-specific reports, we can look in a small region around a specified location and stratify events by type, direction, or season providing diagnostic plots of the synoptic scale events that are deemed important for design criteria.